Analyzing Kaggle Dataset Using PostgreSQL and Python
Executed a comprehensive analysis of a Kaggle dataset through the strategic integration of PostgreSQL and Python. Leveraged SQL queries and Python scripting to extract valuable insights, demonstrating proficiency in data manipulation, analysis, and presentation.
Background & Purpose
Initiated a personal project tailored for learning SQL and mastering database architecture, employing a Kaggle dataset as a sample context. The goal was to leverage SQL skills in designing a robust database structure. This hands-on experience not only deepened my understanding of SQL but also provided practical insights into effective database management using a real-world dataset sourced from Kaggle.
My Process and Components
Define
Researched various sample datasets related to anime production and started defining parameters related to animated TV shows and the initial questions/hypothesis.
Clean
I began by cleaning the dataset we obtained from Kaggle to prepare it for import into PGAdmin. This entailed a thorough data cleaning process to ensure the dataset was in a format compatible with the project's database.
Results and Analysis
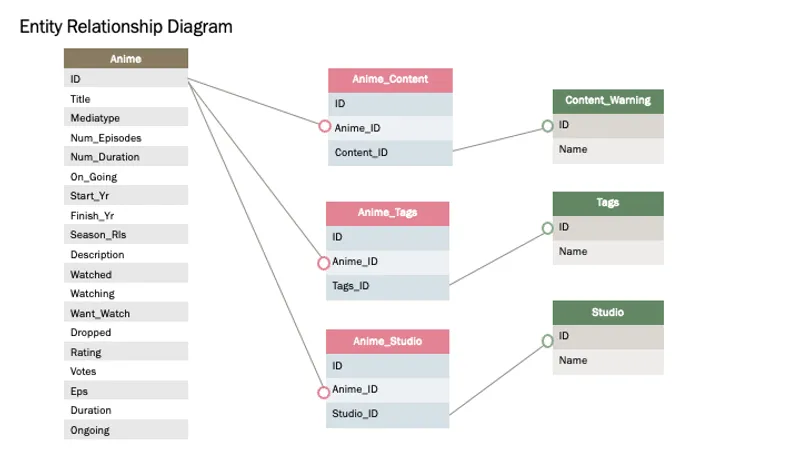
I took on the task of designing and implementing numerous many-to-many tables, a critical step that allowed me to effectively represent complex data relationships in line with our project's objectives. Throughout this procedure, I meticulously fashioned several tables, specifying their types and defining their structure. Example of an Entity Relationship Diagram can be seen. This illustrates the structure and the different data types.
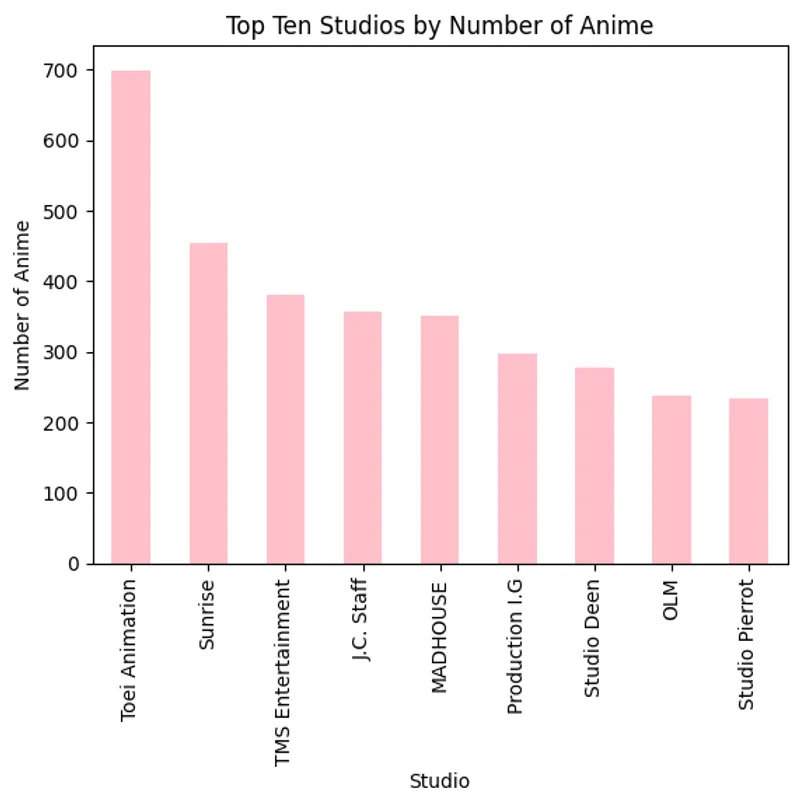
As part of the project's data analysis phase, I combined multiple datasets and wrote SQL queries to extract and present pertinent information about anime studios and their production output. This process involved merging datasets, establishing relationships between tables, and crafting SQL queries to generate valuable insights. The result was a comprehensive view of the anime industry, showcasing the various studios and their respective contributions, as visualized through a bar graph. This allowed us to identify key players in the field and gain a deeper understanding of their production histories.
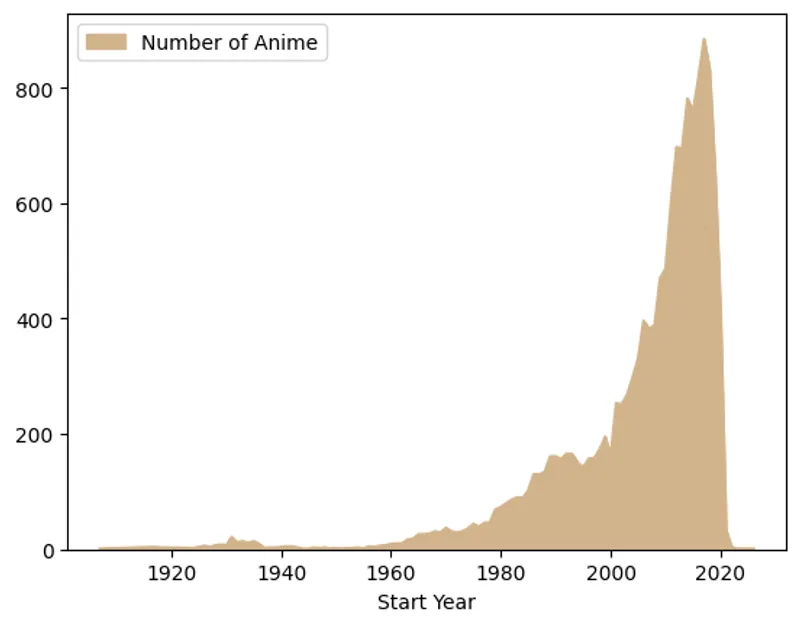
Building upon the foundation of the combined and queried datasets, I expanded the analysis to investigate the annual production trends in the anime industry. To do this, I first needed to clean the data by removing null values and ensuring a robust dataset for the analysis. Subsequently, I crafted SQL queries to group and count the number of anime productions by year. This allowed us to determine which year witnessed the highest production volume, providing valuable insights into the industry's temporal dynamics. The data cleaning step was pivotal in ensuring the accuracy and reliability of the findings.
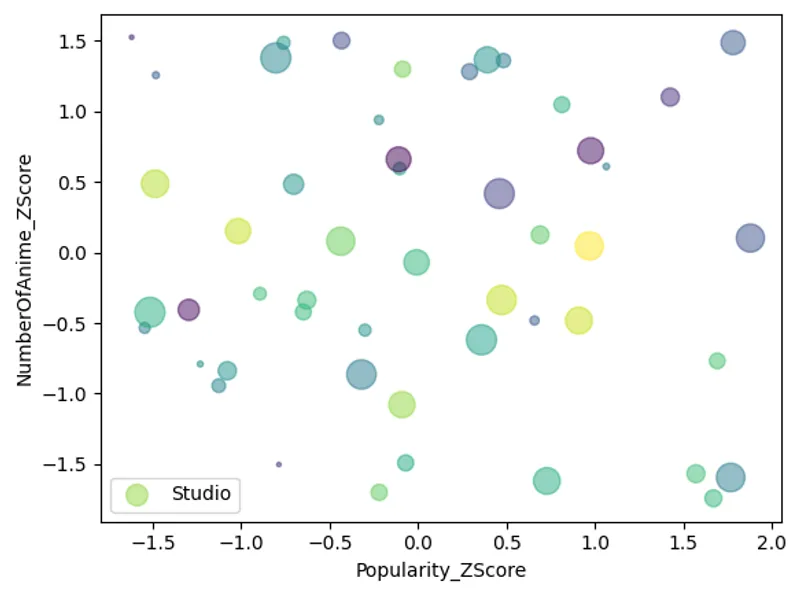
As part of our comprehensive analysis, I also sought to understand the relationship between the number of anime productions by each studio and the average popularity of their work. To achieve this, I meticulously computed the average popularity rating for each anime, connecting this metric to the studio responsible for its creation. This allowed me to discern which studio, regardless of the number of animes they produced, consistently excelled in generating the most popular works in terms of audience reception.
The utilization of z-scores in this analysis was paramount for several reasons. Firstly, it standardized both the number of anime produced and the popularity ratings, enabling fair comparisons between studios. This is particularly important when studios vary significantly in their production output or when dealing with different rating scales for popularity. Additionally, z-scores allowed me to identify studios that outperformed or underperformed relative to the overall dataset, providing a robust statistical basis for our findings and ensuring the integrity of our analysis.
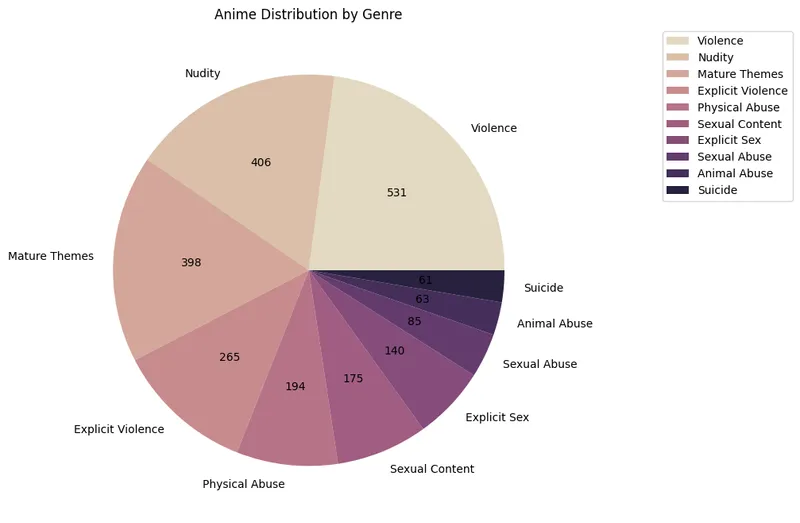
The pie chart titled "Anime Distribution by Genre" provides a visual representation of the number of anime produced across different genres. It offers a concise overview of how the anime industry is distributed among various genres, helping us understand the popularity of different anime themes. Most Popular Genre: The genre with the largest segment indicates the most popular genre of anime, as it has the highest count of anime productions. Less Common Genres: Smaller segments reveal less common genres, indicating the variety within the anime industry. Genre Diversity: The pie chart illustrates the diversity and richness of anime, as it spans a wide range of genres, each catering to different preferences.
A significant observation from the chart is that many of the genres are classified as "Mature Themes," and they collectively represent a substantial portion of the anime produced. This suggests that mature and thought-provoking themes are prevalent in the anime industry, and numerous anime productions explore these complex and adult-oriented narratives. While some genres cater to younger audiences and family-friendly themes, the diversity of mature themes highlights the depth and sophistication of storytelling within the world of anime.
** Please note that It's important to acknowledge that the chart may not represent the anime industry as a whole. Some anime productions may not be categorized into specific genres, resulting in an underrepresentation of these works. As a result, the chart provides insights into the categorized genre preferences of the industry but may not capture the entirety of anime production. Despite this limitation, the chart remains a valuable tool for understanding the distribution of categorized anime genres, offering valuable insights for enthusiasts and analysts. To gain a comprehensive view of the industry, it may be necessary to consider uncategorized or unclassified anime productions in addition to the genres displayed in the chart.
Technical Skills Obtained & Tools Used
-
Data Cleaning using Python
I showcased expertise in data cleaning, utilizing Python, specifically pandas and numpy libraries, to remove null values, ensuring data integrity and quality.
-
SQL Querying
I showcased my ability to craft SQL queries to extract, manipulate, and analyze data from the database, indicating my skill in working with relational databases and querying structured data.
-
Data Visualization
I utilized Python's matplotlib for advanced charting in the anime dataset, showcasing proficiency with complex charts like a cluster bubble scatter plot to highlight the correlation between anime production and popularity ratings.
-
Statistical Data Analysis
The project included in-depth data analysis of an open-source anime dataset, utilizing statistical techniques like average ratings and z-score analysis in SQL and Python for meaningful insights.
-
Database Management
I showcased database management proficiency by importing data into PGAdmin, structuring the schema, and setting up both local PostgreSQL and cloud-based CockroachDB instances.
-
Data Interpretation
I drew insights from the data, such as identifying which studios consistently create popular anime despite production volume, reflecting strong data interpretation skills.